S&P500 Daily Action Areas & Price Targets 10/7/26

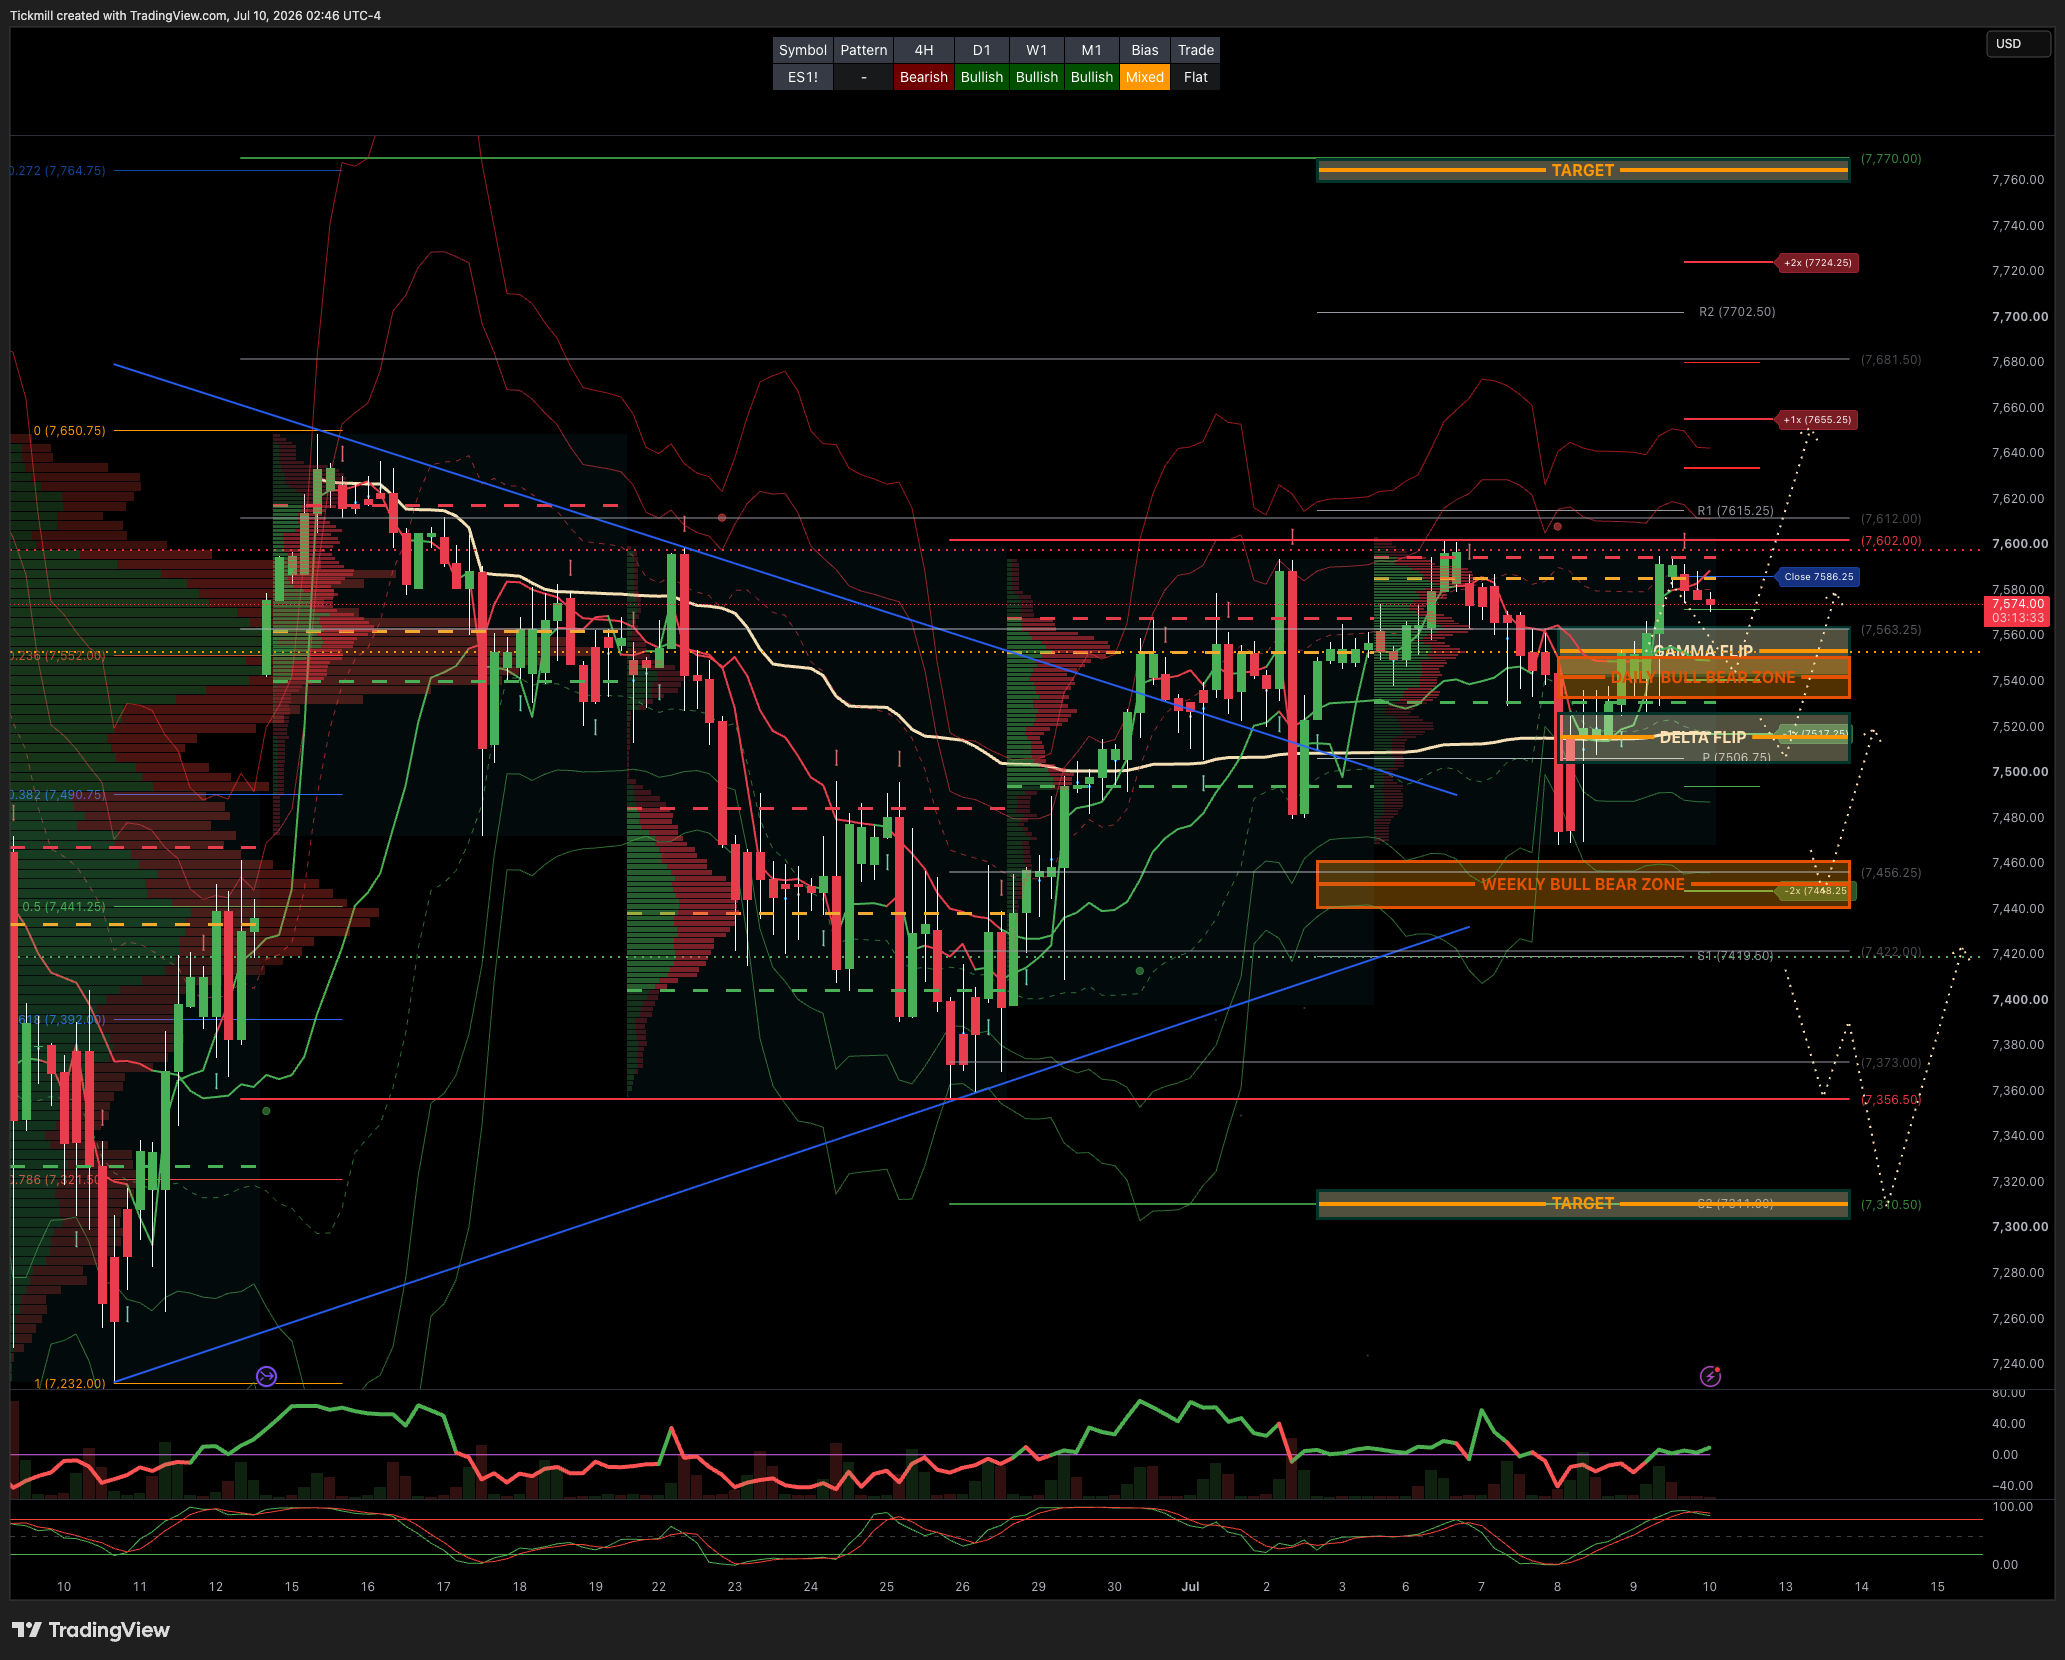
S&P500 Daily Action Areas & Price Targets 10/7/26
***QUOTING ES1! FOR CASH US500 EQUIVALENT LEVELS, SUBTRACT POINT DIFFERENCE***
WEEKLY BULL BEAR ZONE 7460/40
WEEKLY RANGE RES 7628 SUP 7428
MONTHLY RANGE RES 7932 SUP 7384
JHEQX Q3 Collar Short Call Cap: ~7,750 – 7,900 - Long Put Strike: ~7,050 – 7,100 (approx. 5% downside protection) Short Put Strike: ~5,950
DEC2025 OPEX to DEC2026 OPEX is 945 points giving us a range of [5889,7779]
SPX PUT/CALL RATIO 1.12 (The numbers reflect options traded during the current session.) A put-call ratio below 0.7 is generally considered bullish, and a put-call ratio above 1.0 is generally considered bearish.
GS Flow Desk: large S&P 31Aug 7000/7950 strangle in roughly $20mm vega / $115mm premium …My Read – classic “big convexity versus carry” trade: either someone paid a lot to own a wide August move, or someone got paid a lot to bet that the S&P stays comfortably inside the 7000–7950 corridor
DAILY VWAP BULLISH 7550
WEEKLY VWAP BULLISH 7476
MONTHLY VWAP BULLISH 7036
DAILY STRUCTURE - BALANCE 7602/7469
WEEKLY STRUCTURE - BALANCE 7648/7247
MONTHLY STRUCTURE - OTFH - 7199
Balance: This refers to a market condition where prices move within a defined range, reflecting uncertainty as participants await further market-generated information. Our approach to balance includes favouring fade trades at the range extremes (highs/lows) while preparing for potential breakout scenarios if the balance shifts.
One-Time Framing Higher (OTFH): This represents a market trend where each successive bar forms a higher low, signalling a strong and consistent upward movement.
One-Time Framing Lower (OTFL): This describes a market trend where each successive bar forms a lower high, indicating a pronounced and steady downward movement.
DAILY BULL BEAR ZONE 7540/50
GAMMA FLIP 7563
DELTA FLIP 7515
DAILY RANGE RES 7655 SUP 7517
2 SIGMA RES 7724 SUP 7448
VIX BULL BEAR ZONE 17.4
TRADES & TARGETS
LONG ON REJECT/RECLAIM DAILY BULL BEAR ZONE TARGET CLOSE > DAILY RANGE RES
***ADDITIONAL SETUPS & TARGETS HIGHLIGHTED ON THE CHARTS***
(I FADE TESTS OF 2 SIGMA LEVELS ESPECIALLY INTO THE FINAL HOUR OF THE NY CASH SESSION AS 90% OF THE TIME WHEN TESTED THE MARKET WILL CLOSE ABOVE OR BELOW THESE LEVELS)
GOLDMAN SACHS FICC & EQUITIES TRADING DESK VIEWS
The key tactical message is to start adding risk again in the parts of the AI complex where the momentum washout has created a large dislocation between stock performance and earnings growth. The most attractive expressions are data centers and, more selectively, hyperscalers. The selloff in high-beta momentum has now exceeded 20 percentage points in the past week, overshooting short-term expectations for a summer slump, while hyperscaler and data-center equipment valuations have fallen back toward Liberation Day / US-Iran war lows. With earnings season approaching after historic beats from MU and Samsung, plus Meta’s cloud business announcement, the setup is becoming more constructive for buying the dip rather than continuing to chase the unwind.
The case for data centers and hyperscalers is not that the AI capex debate is settled. The longer-term question remains whether the market will eventually reward capital discipline and punish excessive AI spending. AI hardware may still be structurally over-earning and cyclically exposed. But that reflexive shift likely requires one of the major spenders to actually change behavior. If Meta is still ramping capex and launching a cloud business, then the “peak AI spending” message has not arrived yet. Until hyperscalers materially pull back, the demand signal for data-center equipment, networking, memory, construction, and AI infrastructure remains supportive.
Hyperscalers look increasingly interesting because their valuations have compressed sharply while forward earnings estimates remain resilient. They now screen close to historical lows, similar to the Liberation Day and US-Iran stress periods. Positioning also looks much cleaner: Mag7 gross and net exposures have fallen sharply and are only modestly above their respective three-year lows. That matters because hyperscalers had become a funding source for the semis/memory trade. If the AI infrastructure unwind stabilizes, hyperscalers can rally on their own merits; if the crowded memory/semi trade continues to de-risk, hyperscalers may still work as a relative-value hedge because they are under-owned and less stretched.
Data-center equipment also looks attractive after the washout. Aggregate net exposure in US data-center names is now at the lowest level since early Q1, while valuations have fallen toward two-year lows. The basket includes semis, networking, memory chips, and data-center construction, so it remains exposed to AI infrastructure demand but with a broader set of earnings drivers than pure high-beta momentum. The low correlation between hyperscalers and data-center equipment also helps balance overall momentum exposure, making the combined trade cleaner than simply reloading the most crowded semiconductor winners.
The hedge-fund damage from the momentum selloff was meaningful but not catastrophic. Fundamental long/short managers are down 2.2% from June 22 to July 7, including 0.8% of negative alpha, but remain up a strong 15.5% YTD. The main alpha drags were Info Tech and momentum, and managers have aggressively cut the AI long exposure that drove their YTD alpha through late June. That selling has materially reduced their momentum exposure and pushed gross leverage to the bottom decile over the past year. This is important because it suggests the trade has been de-risked significantly, but not because funds were forced into existential liquidation; rather, they were protecting strong first-half gains.
Systematic long/short managers have had a more painful episode, falling 3.6% from June 22 to July 7, their worst drawdown since summer 2025, giving back roughly a quarter of YTD performance. They are still up 10.8% YTD, down from 14.4% on June 22. The pain was concentrated on the short side, led by US equities, followed by developed Asia and Europe, while EM Asia was volatile but roughly flat overall. Momentum and crowded trades were the main negative drivers. Again, this points to a factor and crowding event rather than a broad equity bear turn.
The market-structure issue from semis leveraged ETFs is crucial. Levered semis ETF exposure peaked in mid-June at roughly $157bn and had fallen to around $104bn by Tuesday, implying roughly $53bn of semis sold from levered products as AI stocks declined. This is not just a flow statistic; it changes the volatility and rebalancing dynamics of the market. At the peak, semis levered ETFs created around $2.8bn of daily short gamma, meaning a 3% up day in semis required roughly $8.5bn of buying from levered rebalancing, while a 3% down day required the same amount of selling. That daily gamma has now fallen to around $1.9bn, still large but meaningfully reduced.
This helps explain why moves in semis have felt so violent. The decline was amplified by mechanical selling from levered ETFs, not just discretionary fundamental de-risking. As exposure falls, the same mechanical pressure should become less extreme, though it remains a risk if semis continue to gap lower. The reduction in levered ETF gamma is therefore a double-edged signal: it confirms how much forced/structural selling occurred, but it also suggests that one source of downside convexity has already been partially reduced.
The broader ETF ecosystem is also becoming a major market-structure driver. June was the second-largest month of ETF inflows in the dataset at $193bn, and over the past seven months the industry has recorded five of its largest monthly inflow totals. Capital has followed the themes that worked: US mega-caps, semis/AI, EM/Korea, and actively managed concentrated portfolios. Active ETFs have gathered around $400bn YTD, representing roughly 40% of industry inflows despite being a much smaller share of total AUM. That shows how much market access is now flowing through active and thematic ETF structures rather than traditional single-stock selection.
Levered ETFs are especially important. Notional volumes across the levered ETF complex reached a monthly record of $1.1tn in June and are tracking 50% above 2025 levels. Adjusted for exposure, levered ETFs represented roughly 40% of June US-listed ETF notional volumes. They account for $175bn of AUM but more than $430bn of gross exposure. This matters because levered and inverse ETFs can turn directional moves into self-reinforcing rebalancing flows, especially in thin liquidity and crowded themes. With more than 770 ETFs launched this year, 54% using derivatives and 33% classified as levered or inverse, ETF structure itself has become a bigger contributor to realized volatility.
The DRAM versus EWY example shows how quickly thematic access vehicles can change flows. DRAM has overtaken EWY in assets, despite EWY being a 26-year-old ETF and historically serving as a proxy for international memory exposure. EWY has a 46% overlap with DRAM but has seen $2bn of outflows since April despite its NAV rising around 50%. This illustrates how new, concentrated thematic products can redirect capital away from older country-level proxies and into purer exposures. It also helps explain why some AI/memory-linked trades have become so crowded and mechanically sensitive.
Disclaimer: The material provided is for information purposes only and should not be considered as investment advice. The views, information, or opinions expressed in the text belong solely to the author, and not to the author’s employer, organization, committee or other group or individual or company.
Past performance is not indicative of future results.
High Risk Warning: CFDs are complex instruments and come with a high risk of losing money rapidly due to leverage. 69% and 73% of retail investor accounts lose money when trading CFDs with Tickmill UK Ltd and Tickmill Europe Ltd respectively. You should consider whether you understand how CFDs work and whether you can afford to take the high risk of losing your money.
Futures and Options: Trading futures and options on margin carries a high degree of risk and may result in losses exceeding your initial investment. These products are not suitable for all investors. Ensure you fully understand the risks and take appropriate care to manage your risk.
Patrick has been involved in the financial markets for well over a decade as a self-educated professional trader and money manager. Flitting between the roles of market commentator, analyst and mentor, Patrick has improved the technical skills and psychological stance of literally hundreds of traders – coaching them to become savvy market operators!