S&P500 Daily Action Areas & Price Targets 7/7/26

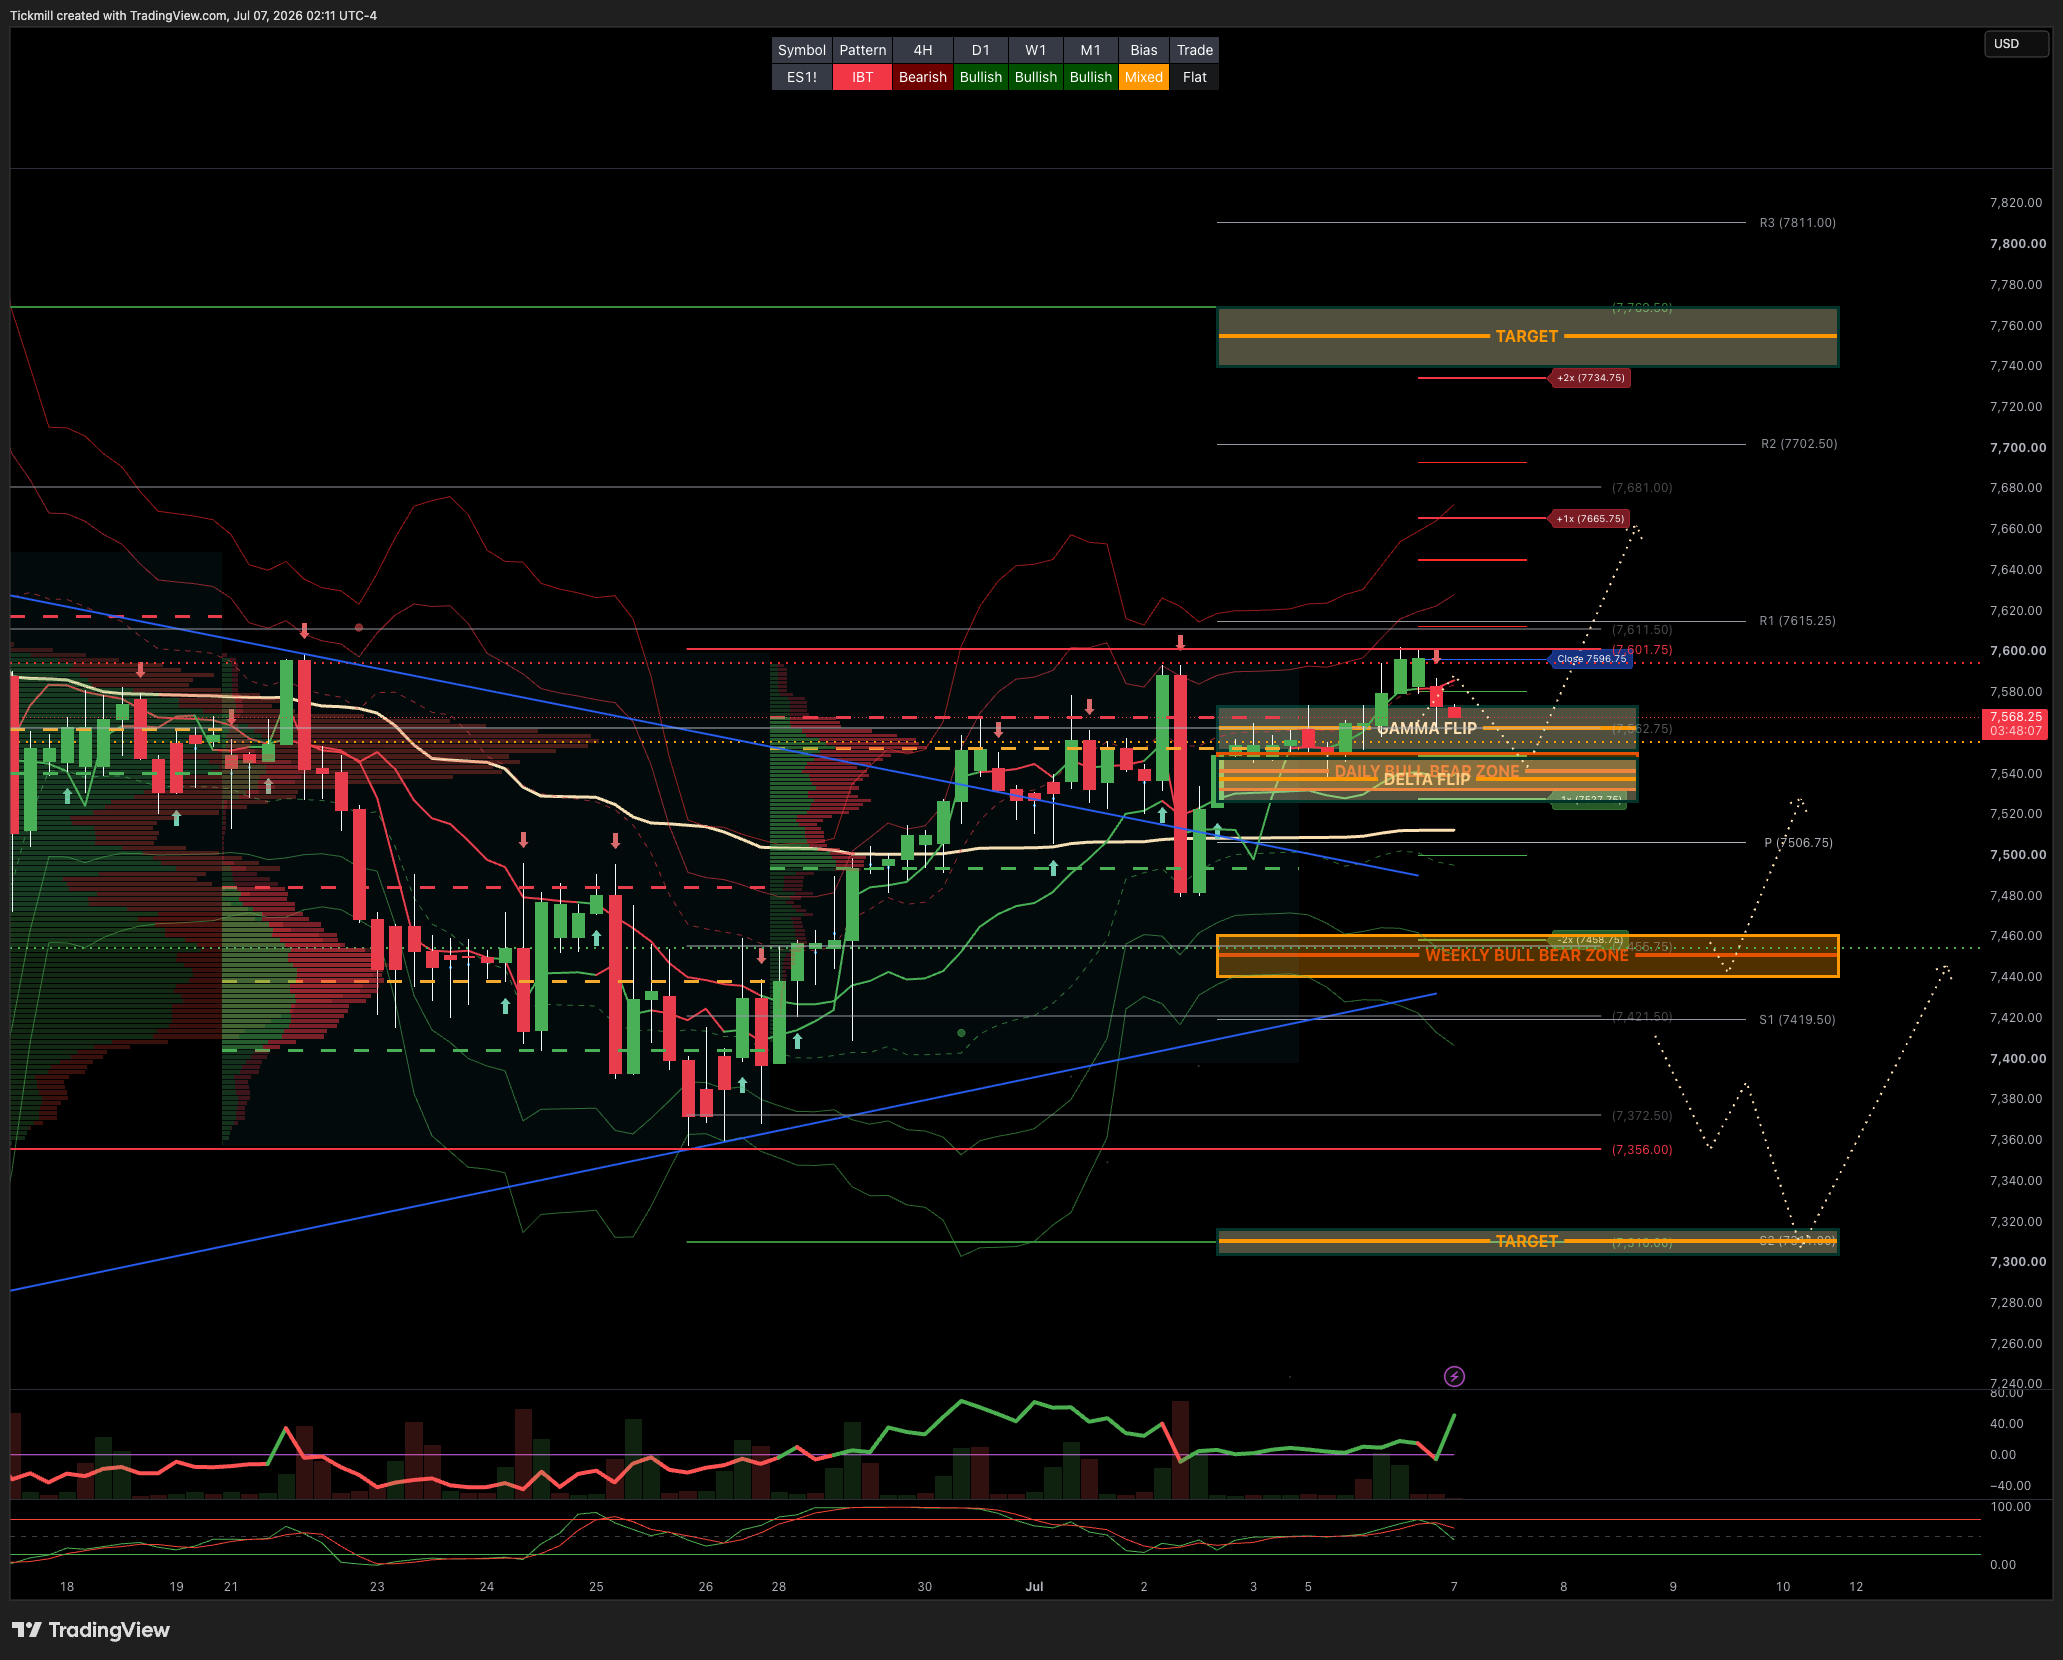
S&P500 Daily Action Areas & Price Targets 7/7/26
***QUOTING ES1! FOR CASH US500 EQUIVALENT LEVELS, SUBTRACT POINT DIFFERENCE***
WEEKLY BULL BEAR ZONE 7460/40
WEEKLY RANGE RES 7628 SUP 7428
MONTHLY RANGE RES 7932 SUP 7384
JHEQX Q3 Collar Short Call Cap: ~7,750 – 7,900 - Long Put Strike: ~7,050 – 7,100 (approx. 5% downside protection) Short Put Strike: ~5,950
DEC2025 OPEX to DEC2026 OPEX is 945 points giving us a range of [5889,7779]
SPX PUT/CALL RATIO 1.12 (The numbers reflect options traded during the current session.) A put-call ratio below 0.7 is generally considered bullish, and a put-call ratio above 1.0 is generally considered bearish.
GS Flow Desk: large S&P 31Aug 7000/7950 strangle in roughly $20mm vega / $115mm premium …My Read – classic “big convexity versus carry” trade: either someone paid a lot to own a wide August move, or someone got paid a lot to bet that the S&P stays comfortably inside the 7000–7950 corridor
DAILY VWAP BULLISH 7550
WEEKLY VWAP BULLISH 7476
MONTHLY VWAP BULLISH 7036
DAILY STRUCTURE - OTFH 7552
WEEKLY STRUCTURE - BALANCE 7648/7247
MONTHLY STRUCTURE - OTFH - 7199
Balance: This refers to a market condition where prices move within a defined range, reflecting uncertainty as participants await further market-generated information. Our approach to balance includes favouring fade trades at the range extremes (highs/lows) while preparing for potential breakout scenarios if the balance shifts.
One-Time Framing Higher (OTFH): This represents a market trend where each successive bar forms a higher low, signalling a strong and consistent upward movement.
One-Time Framing Lower (OTFL): This describes a market trend where each successive bar forms a lower high, indicating a pronounced and steady downward movement.
DAILY BULL BEAR ZONE 7550/40
GAMMA FLIP 7562
DELTA FLIP 7536
DAILY RANGE RES 7666 SUP 7527
2 SIGMA RES 7729 SUP 7458
VIX BULL BEAR ZONE 17.4
TRADES & TARGETS
LONG ON REJECT/RECLAIM DAILY BULL BEAR ZONE TARGET CLOSE > DAILY RANGE RES
***ADDITIONAL SETUPS & TARGETS HIGHLIGHTED ON THE CHARTS***
(I FADE TESTS OF 2 SIGMA LEVELS ESPECIALLY INTO THE FINAL HOUR OF THE NY CASH SESSION AS 90% OF THE TIME WHEN TESTED THE MARKET WILL CLOSE ABOVE OR BELOW THESE LEVELS)
GOLDMAN SACHS FICC & EQUITIES TRADING DESK VIEWS
US equities staged a solid relief rally in a quiet, low-volume session, with the S&P 500 up 72bps to 7,537, the NDX up 126bps to 29,697, the Russell 2000 up 48bps to 3,010, and the Dow up 29bps to 53,055. Volumes were light at 16.882bn shares versus a YTD daily average of 19.706bn, roughly 20% below the recent run-rate, and the close saw a sizeable $8bn MOC for sale. Despite that supply, the market held firm, helped by a reset lower in volatility, with VIX down to 15.57, and contained moves across rates, oil, FX, and gold. WTI was essentially flat at $68.65, the 10-year yield was little changed at 4.4673%, DXY was flat at 101.87, and Bitcoin gained 141bps to $63,563.
The rally was led by tech and had a clear short-covering / squeeze element, with GS short baskets up 1–3% on the day. NDX and SOX both held above their 50-day moving averages, which was important after last week’s sharp AI and momentum selloff. The GS TMT Momentum Pair bounced around 160bps after falling more than 25% from its highs, a drawdown that broadly matches the largest pullbacks seen over the past five years. That supports the view that last week’s move was a violent positioning reset rather than an outright break in the AI regime, though it does not eliminate the risk of further factor volatility.
The broader context is that the AI trade had an extraordinary 2Q run, with semis up roughly 90% across April and May while experiencing only a couple of modest 5% pullbacks. Against that backdrop, a sharper rebalancing in the “sharp” end of the AI trade seems reasonable even if the underlying direction of travel has not changed. Hon Hai’s June revenue growth of 52% YoY is a useful reminder that the fundamental AI infrastructure demand story remains intact, even as investors reassess positioning, valuation, and profit-taking after the first-half surge.
At the same time, the market is increasingly re-examining “the rest” into H2 as macro headwinds ease. Oil has reset lower, economic data remain solid enough, and the softer NFP has reduced immediate Fed hike concerns. A number of non-semiconductor charts are starting to look more constructive, including AAPL, AXON, DASH, TTWO, AFRM, ABNB, PANW, OKTA, FWONK, COMP, and others. This fits the broader rotation framework: the market is not necessarily abandoning AI, but it is broadening beyond semis, memory, and infrastructure into megacap platforms, software, cyclicals, and select laggards.
Consumer stocks were the soft spot, with pressure there standing out against the broader tech-led rally. That bears watching because the macro narrative still depends on the consumer remaining resilient. The softer jobs report reduced rate pressure, but the details were not uniformly strong, particularly given weaker participation and soft leisure/hospitality hiring. Upcoming reports from PEP on Thursday and DAL on Friday will provide early reads on pricing power, travel demand, margins, and consumer elasticity ahead of the broader earnings season.
The near-term catalyst calendar is relatively light but still important. ISM Services came in roughly in line, with orders a small miss, which supports the “solid enough” growth narrative without reviving immediate hike fears. Wednesday’s FOMC minutes are the main macro event, as investors will look for details behind the June hawkish projections and whether the committee pushes back against the post-NFP dovish repricing. The NATO Summit may also generate geopolitical headlines, though for now geopolitics has taken a backseat as Hormuz traffic recovers and crude remains contained. Samsung’s preliminary earnings are the key AI catalyst this week, particularly for memory, HBM, and the broader semis complex.
Flow activity was muted, with the floor only a 3 out of 10 in terms of overall activity, but the desk still finished 624bps to buy versus a 30-day average of 48bps to buy. Poor liquidity likely exaggerated some of the under-the-surface moves. Asset managers were net buyers, led by tech, financials, and communication services, while hedge funds finished roughly flat, with small supply in tech, consumer discretionary, and staples offset by demand in healthcare. The market’s ability to absorb a sizeable MOC sell imbalance while still closing higher was constructive, though the light-volume backdrop means the signal should not be overread.
Disclaimer: The material provided is for information purposes only and should not be considered as investment advice. The views, information, or opinions expressed in the text belong solely to the author, and not to the author’s employer, organization, committee or other group or individual or company.
Past performance is not indicative of future results.
High Risk Warning: CFDs are complex instruments and come with a high risk of losing money rapidly due to leverage. 69% and 73% of retail investor accounts lose money when trading CFDs with Tickmill UK Ltd and Tickmill Europe Ltd respectively. You should consider whether you understand how CFDs work and whether you can afford to take the high risk of losing your money.
Futures and Options: Trading futures and options on margin carries a high degree of risk and may result in losses exceeding your initial investment. These products are not suitable for all investors. Ensure you fully understand the risks and take appropriate care to manage your risk.
Patrick has been involved in the financial markets for well over a decade as a self-educated professional trader and money manager. Flitting between the roles of market commentator, analyst and mentor, Patrick has improved the technical skills and psychological stance of literally hundreds of traders – coaching them to become savvy market operators!